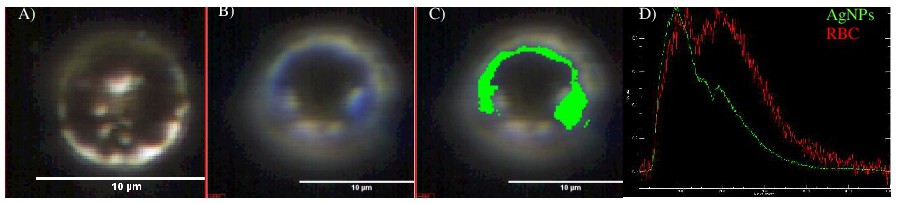
Fig. 4. Hyperspectral imaging of CR AgNPs in human red blood cells. CytoViva(r) optical image of A) a control red blood cell (RBC), B) a RBC exposed to negatively charged CR AgNPs of 10 nm in diameter for 1 h, and C) the same RBC exposed to AgNPs- after mapping the AgNPs spectral library created at B) against the hyperspectral image. The "green" color coded pixels reveal the presence of AgNPs-, which were taken up by the RBC. D) Hyperspectral signatures of AgNPs (green spectrum) and RBC (red spectrum) controls used in the component's identification. CytoViva(r) System Description: The images and data were captured using an Olympus research grade optical microscope equipped with CytoViva (Auburn, AL) patented enhanced darkfield illumination optics and full spectrum aluminum halogen source illumination. The CytoViva(r) system was used in conjunction with a hyperspectral imaging system, producing spectral image files from 400-1,000 nm at 2 nm spectral resolution. CytoViva's customized version of ENVI hyperspectral image analysis software was utilized to quantify the spectral response of the sample and to conduct any spectral mapping of the sample elements.